Low-Carbon & Circular Operations
Our Operations, Measured and Improving
Low-Carbon & Circular Operations
Through energy efficiency, renewable electricity, waste reduction, responsible water management and stronger emissions monitoring, we are embedding sustainability into site-level decision-making and long-term business resilience.
Environmental Management provides the structure that guides how Filtrona manages climate-related and environmental risks across its operations. It includes our Climate Transition Plan, ISO 14001-certified environmental management systems, site-level controls, environmental compliance, risk management and performance monitoring.
Our Climate Transition Plan
Formally adopted in FY2025, the Plan defines our decarbonisation pathway and is integrated into capital allocation and procurement planning.
Our Achievements
51% reduction in Scope 1 & 2 GHG emissions vs. 2022 baseline
A 51% reduction in Scope 1 and 2 emissions against our 2022 baseline — driven by renewable energy sourcing, energy efficiency programmes at all sites, and process optimisation. This puts us on track for our SBTi-validated near-term target of 58% reduction by 2030.
Value Chain Emissions (Scope 3)
Scope 3 emissions — the indirect greenhouse gas emissions that occur across our supply chain and product value chain — represent 97% of Filtrona’s total carbon footprint. The single largest contributor is the raw materials we purchase, particularly cellulose acetate, which is produced through an energy-intensive chemical conversion process.
This is why reducing Scope 3 is inseparable from our product strategy. Transitioning the portfolio toward plastic-free, paper-based filter materials through the ECO Range directly reduces the embedded carbon in what we source — and what our customers buy from us.
Our Scope 3 reduction targets have been validated by the Science Based Targets initiative (SBTi). Our near-term commitment is to reduce scope 3 emissions by 63% by 2035 against our 2023 baseline. Our long-term commitment is net-zero across the full value chain by 2050.
FY2025 at a glance
Full Scope 3 methodology and category data are available in our Sustainability Report 2025.
Customers requiring product-level carbon data for their own Scope 3 reporting can request our supplier data pack.
Outlook
The next phase will focus on disciplined execution. Filtrona will continue integrating climate considerations into capital allocation, procurement decisions and operational planning. We will also strengthen data quality and use decarbonisation analysis to prioritise actions that are both environmentally impactful and commercially viable.
Filtrona manages waste through prevention, reduction, reuse and recycling — and has maintained zero waste to landfill across all manufacturing sites. Across our sites, waste is managed through structured processes covering identification, segregation, handling, recycling, recovery and compliant disposal. Filtrona applies the waste hierarchy by prioritising prevention, reduction, reuse and recycling before disposal.
Our Achievements
Zero Waste to Landfill maintained in 2025
Recycling rate of 53%
23% Improvement in Waste Intensity between 2022 and 2025
In 2025, Filtrona maintained zero waste to landfill across its operations, excluding regulated hazardous waste streams where applicable. Total waste generated was 4,435.04 tonnes, with 2,368.80 tonnes recycled and a recycling rate of 53%.Waste intensity also improved by 23% between 2022 and 2025, reflecting stronger process efficiency and better waste management practices across operations.
Outlook
Filtrona will continue scaling circular waste practices by reducing waste at source, improving segregation and increasing recovery quality. The focus will be on driving greater consistency across all sites so that circularity becomes a standard part of operational excellence.
Energy efficiency is both an environmental priority and a business resilience measure — reducing exposure to energy price volatility while cutting emissions. In 2025, total energy consumption fell 30% versus the 2022 baseline, and renewable electricity reached 37% of total consumption.
Our Achievements
30% Reduction in Total Energy Consumption in 2025 vs 2022 baseline
Renewable electricity reached 37% of total consumption in 2025, up from 8% in 2022.
Energy efficiency continued to be one of the strongest drivers of emissions reduction. In 2025, total energy consumption declined by approximately 30% compared with the 2022 baseline, while renewable electricity increased to 37%. Filtrona’s total energy consumption in 2025 was 42,852,760.68 kWh, with on-site renewable energy generation reaching 2,643,730.85 kWh. These efforts contributed directly to the 51% reduction in Scope 1 and 2 emissions.
Outlook
Filtrona will continue improving energy efficiency, expanding renewable electricity and strengthening supplier engagement to address value chain emissions. Our long-term targets include a 58% reduction in Scope 1 and 2 emissions by 2030, 95% by 2040 from 2022 base year 100% renewable electricity by 2040 and net-zero value chain emissions by 2050.
Water stewardship is part of Filtrona’s environmental management across all sites, with particular focus on regions facing higher water stress.
Our Achievements
Zero Wastewater Discharge in our India sites
Responsible Water Management through Site-level Controls and Compliance Procedures
In 2025, Filtrona continued to manage water responsibly through site-level controls and compliance procedures. Total water withdrawal was 92,685.41 cubic metres, while wastewater discharge was 81,414.17 cubic metres. Our India sites maintained zero wastewater discharge, supported by treatment and reuse systems that exceed minimum regulatory requirements.
Outlook
Filtrona will continue assessing opportunities to extend zero wastewater discharge practices to other sites where technically and locally feasible. We will also improve water monitoring and data management, particularly in regions facing higher water stress.
Air Emissions Management covers the monitoring and control of pollutants such as nitrogen oxides, particulate matter and other combustion-related emissions. Filtrona monitors and reports air emissions as part of its environmental management system and regulatory compliance obligations.
Our Achievements
Introduced Estimated Air Pollution Load Reporting
1.92 million kg Total estimated air pollution load
959,565.52 kg NOx emissions
959,088.67 kgPM/Dust emissions
In 2025 Filtrona introduced estimated air pollution load reporting for the first time, establishing a baseline against which future reductions will be tracked. Total estimated load was 1.92 million kg, predominantly NOx and PM from biomass boilers — data that will now inform operational decisions and improvement priorities.
Outlook
Filtrona will continue improving emissions data quality, strengthening monitoring practices and increasing the use of measured data where available. This will support better operational decision-making and alignment with evolving regulatory expectations.
See the Next Pillar
Sustainability Report 2025
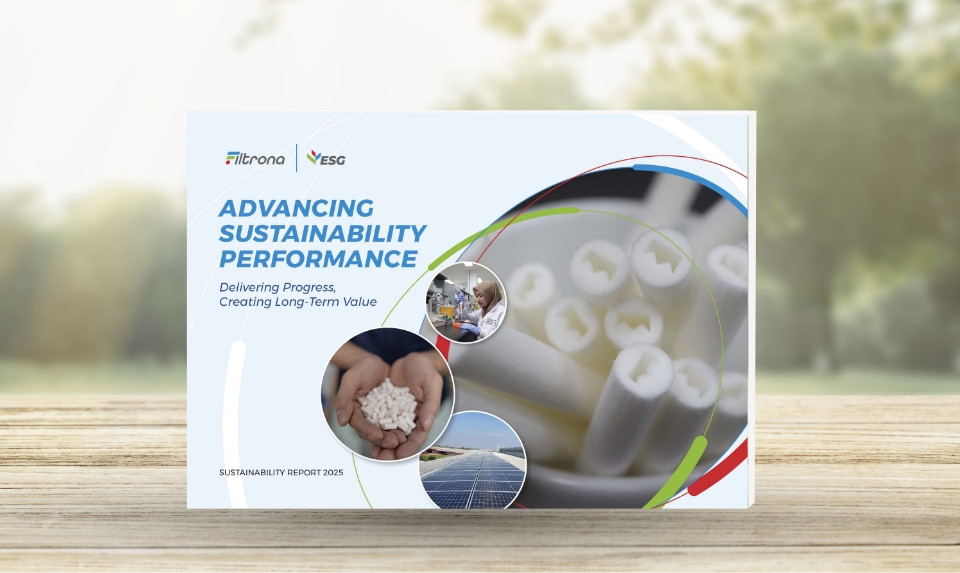
Our 2025 Sustainability Report marks a significant step forward. Going beyond our previous reporting to offer a more complete, transparent picture of how we operate and where we stand on our ESG commitments.
This year’s report introduces broader disclosures across our environmental impact, social performance, and governance practices. We’ve deepened our data coverage, added new metrics, and provided greater context around the progress on our sustainability journey.
To further validate our commitments, the report has been independently assured by SGS under the AA1000 Assurance Standard v3 (Type 2, Moderate Assurance).
Sustainability Report 2024

The Filtrona Sustainability Report 2024 demonstrates our unwavering commitment to sustainable, efficient, and socially responsible business practices.
It serves as a vital communication platform, fostering meaningful engagement with our stakeholders, including employees, customers, investors, regulatory bodies, suppliers, and the broader public.
This report outlines our strategic roadmap for achieving our ESG goals, with clear metrics to monitor the progress on our sustainability journey.
Sustainability Report 2023

Our 2025 Sustainability Report marks a significant step forward. Going beyond our previous reporting to offer a more complete, transparent picture of how we operate and where we stand on our ESG commitments.
This year’s report introduces broader disclosures across our environmental impact, social performance, and governance practices. We’ve deepened our data coverage, added new metrics, and provided greater context around the progress on our sustainability journey.
To further validate our commitments, the report has been independently assured by SGS under the AA1000 Assurance Standard v3 (Type 2, Moderate Assurance).